

Loading content…
Customers creating value with Seerene
01Today’s starting point
Condensed status can look green while production is already red.
Useful signals exist today: flow and value-stream metrics, engineering productivity, code and architecture intelligence, delivery metrics. Each illuminates its own stage with its own definitions. Condensed into one status for the board, the connections between them disappear.
Why it happens
Every condensation step removes context. A green status says the plan is met. It does not say what capacity that took, where it was borrowed from, or which line will slip next. Research on project status reporting found 60 % of reports biased, more than twice as often optimistic as pessimistic.*
What leadership needs
Not more status, but one yardstick for every production line and an answer no report gives today: are we getting better or worse as a whole — and where? Read per production line, across the portfolio and at every management level, traceable to the evidence.
* Studies summarized in MIT Sloan Management Review, 2014.
Why it happens+
Every condensation step removes context. A green status says the plan is met. It does not say what capacity that took, where it was borrowed from, or which line will slip next. Research on project status reporting found 60 % of reports biased, more than twice as often optimistic as pessimistic.*
What leadership needs+
Not more status, but one yardstick for every production line and an answer no report gives today: are we getting better or worse as a whole — and where? Read per production line, across the portfolio and at every management level, traceable to the evidence.
* Studies summarized in MIT Sloan Management Review, 2014.
What is missing is the connection along the development flow, across production lines and through the management layers: the three axes of the governance gap.
Production line
As reportedQ3 board pack
Observed in productionsame quarter · capacity per line
{{ l.n }}
{{ l.name }}
{{ l.reported }}Budget as planned
No risks open
No risks open
{{ l.fig }}
{{ l.obs }}
Condensed from management dashboard, PMO status and delivery metrics, each with its own definitions.
New valueReworkWaiting or lent
One connected cause
Line 2 rework → capacity lent from Line 3 → Line 1 release slips. Three green rows, one cause that no single status shows.
Three production lines, one quarter · a scenario, not a customer result.
What leadership can decide
Validate the shared constraint with engineering, then prioritize the structural work and review the capacity mix and delivery impact.
A possible decision in this scenario, to be validated with engineering; not a reported customer result.
Inside the Digital Boardroom
Capacity flow by production line
The view shows how much of 100 % funded developer time remains for value-add and which friction types absorb the rest, per production line. Open to enlarge.
See the capacity view behind this question →Why now
AI moves the bottleneck from writing code to governing it.
AI assistants raise code output faster than review, integration and portfolio decisions can absorb it. The 2025 DORA report finds AI adoption near-universal, throughput up and delivery stability still down; a 2026 industry survey reports 85 % of respondents locating the bottleneck at review and validation, and 80 % having introduced tools faster than rules. The governance task exists without AI; AI makes it urgent — and many organizations do not yet measure its effect on one definition.
Sources: DORA, State of AI-assisted Software Development 2025 · GitLab/Harris Poll, AI Accountability Report, June 2026.
How AI impact is measured on one definition →Throughput up, stability still down
AI adoption near-universal; delivery stability negative.
DORA 2025
85 %locate the bottleneck at review and validation
80 % introduced tools faster than rules.
GitLab/Harris Poll, 2026
02The governance gap
Three questions you cannot answer independently today.
Your production lines are run well — each for itself. What no line can give you is the view across them. Along three axes, today’s answer comes from reports that were condensed, translated and interpreted on their way up.
Seerene connects the three axes into one evidence layer: one comparable view, one evidence path for every management level — the structure of everything the Digital Boardroom shows.
How the view is built →Three-axes model: X along one production line, Y lines 1…N, Z from teams to the board.
03The result · the Digital Boardroom
One view per management level, on the same information space.
Select a management level to see its views. Every figure stays traceable to the evidence beneath it, and the same question can be followed down to the system and the code.
Management question
{{ lvl.q }}
Who asks
{{ lvl.role }}
Seerene makes visible
{{ lvl.views }}
Reading the view
{{ lvl.legend }}
A possible decision
{{ lvl.decide }}
{{ lvl.cap }} · Digital Boardroom view · open to enlargeLevel · {{ lvl.name }}
Use casesCompare delivery partnersPrioritize improvementsReview critical application riskAll four use cases →
Systems, not peopleNo individual monitoring; works-council reviews documented in DACH.
Read-only by designSource code stays in place; Seerene reads metadata from the existing toolchain.
About 30 daysBaseline typically about 30 days from data readiness, coordinated by one technical contact.
Next step
Bring the decision you have to defend next.
A 30-minute Executive Briefing with Seerene’s leadership: one management question, the evidence that would settle it, a written summary you can forward.
04How it is used · the condition
One executive impulse in, connected evidence back — review after review.
Leadership sets the question; Seerene connects the signals from the existing systems and aggregates them upward, traceable at every level. The loop closes only when the executive who set the impulse reads the answer: 15 minutes per executive review with your direct reports, aligned with your management cadence, one verified view, three decisions — where are we off track, who acts next, what changes before the next review. The technical validation can be delegated; the decision cannot.
The first four to six rounds are guided by Seerene, because the first deviations always raise objections. That is the mechanism working, not failing: every deviation gets the team’s explanation before it is decided.
{{ d.title }}. {{ d.body }}
One closed loop: the CXO, CTO or CIO sets the question; the impulse enters every level and reaches the toolchain, and connected evidence returns to the executive who asked — traceable at every level. The board receives a consistent view of the same evidence.
Traceability · from the board question to the Software Map
A number can be argued with. A map of the code it comes from cannot: every figure opens to the production line, the system, the component and its change history — without source code leaving your environment.
{{ t.n }}{{ t.title }}
{{ t.kind }}
{{ t.body }}
Digital Boardroom views and Software Map. Observation, technical interpretation and leadership decision are kept apart; causes are expressed at team and system level, with no individual attribution.
05Every seat at the table
One evidence baseline. Five leadership questions.
Different questions, one reality. ERP and CRM gave operations and sales one trusted fact base; software production still lacks it. Choose a seat to see its question, what becomes visible and the decision it supports.
Management question
{{ role.q }}
Seerene makes visible
{{ role.visible }}
Your decision
{{ role.decide }}
Level · {{ role.levelName }}{{ role.go }} →
The CTO or CIO owns the view. CEO, CFO and board read the same evidence; engineering leadership works on the causes at its own level. The one-page Executive Brief to forward internally →
06Origin and proof

“{{ quote.text }}”
{{ quoteRole }}
Research origin
A Hasso Plattner Institute spin-off, built on 15+ years of research in software visualization and analytics.
Used where oversight is strict
Large, regulated organizations in the DACH region; no individual monitoring, works-council reviews documented.
Nothing leaves the house
Read-only connection to the existing toolchain; source code stays in place; team and system level only.
07Software Excellence Network
Where senior leaders shape the future of software production.
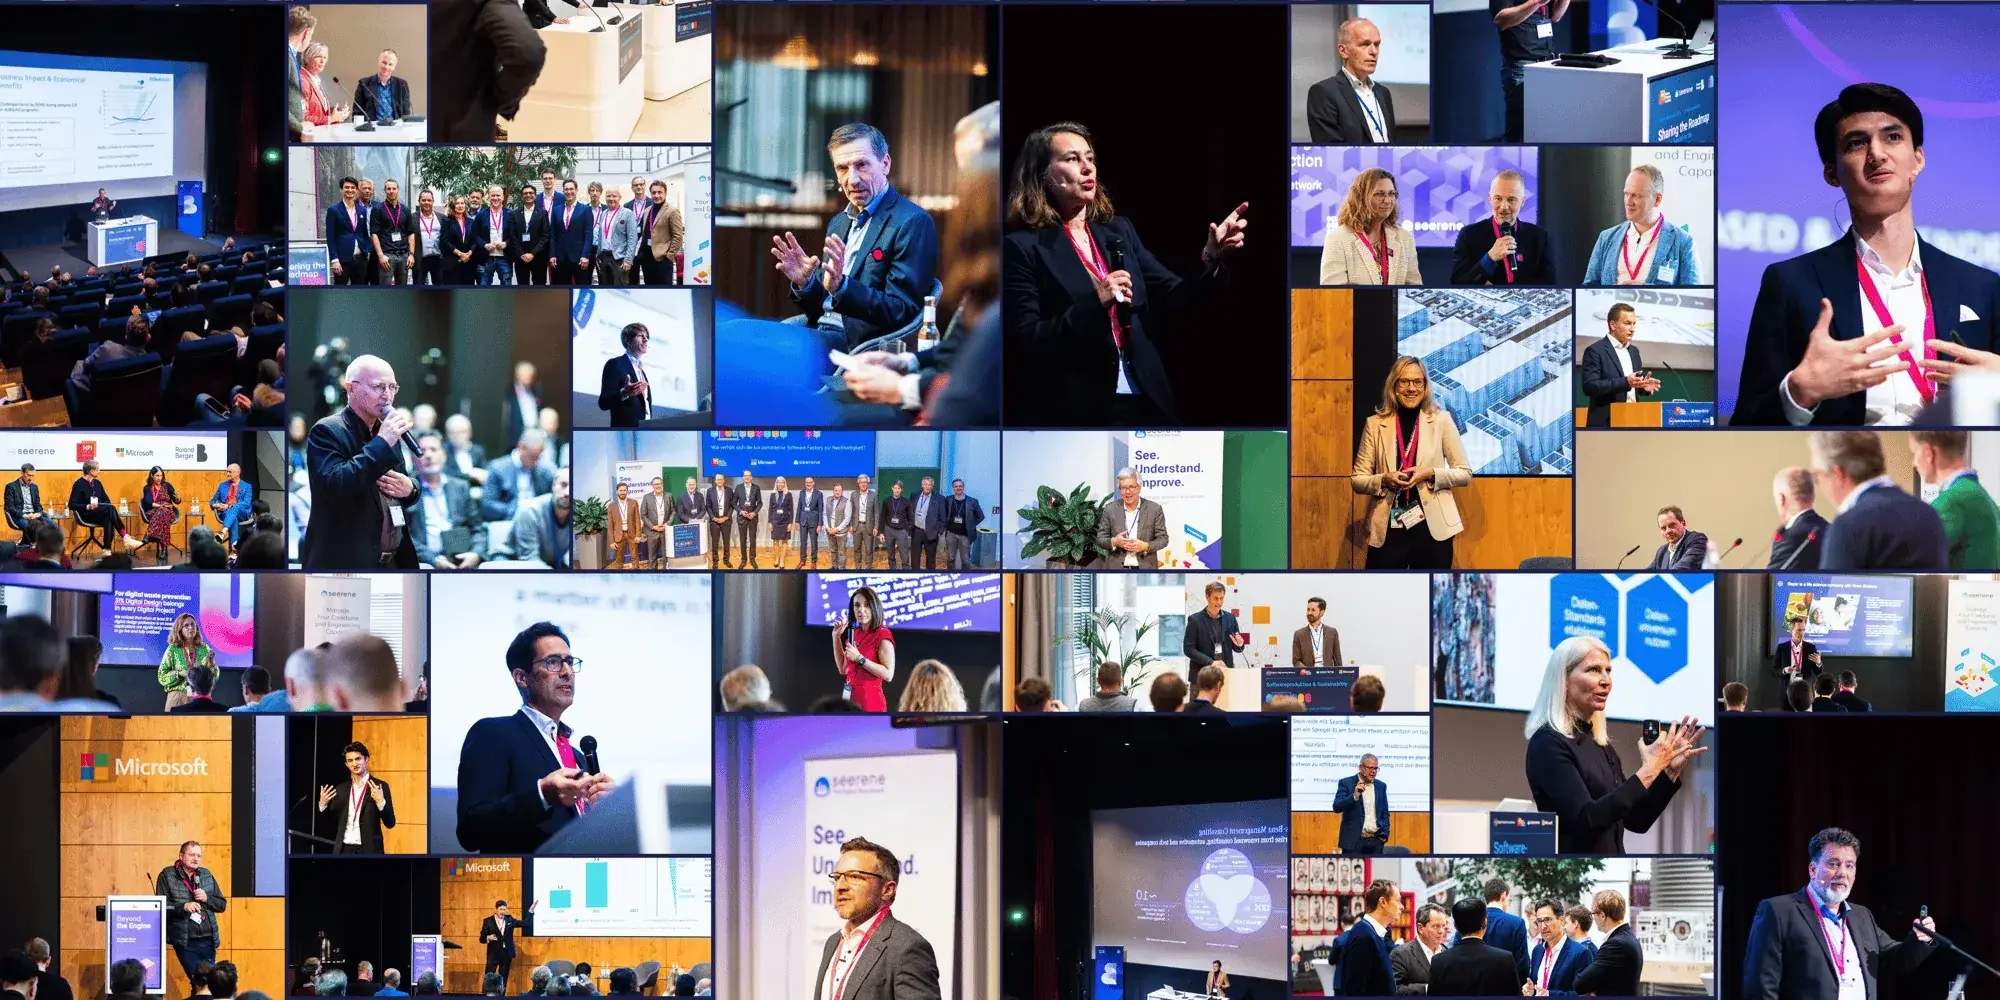
A confidential peer forum for C-level and engineering leaders, founded by Seerene and run with the Hasso Plattner Institute and the German Deep Tech Group: peer exchange off the record, masterclasses with practitioners, early research from academia and sector forums.
08Insights
Two recent perspectives on governing software production.
In depth
Questions leaders ask before a briefing.
Short answers, each with the page that goes deeper. The full argument is in the Executive Brief.
{{ f.q }}
{{ f.a }}
{{ f.more }}09How to start
From a 30-minute Executive Briefing to your first management review.
-
{{ t.n }}
{{ t.title }}
{{ t.when }}
{{ t.body }}

{{ pf }}
{{ s.marker }}
{{ s.h1 }}
{{ s.lead }}
{{ s.decision.marker }}
{{ s.decision.q }}
{{ s.decision.visibleLabel }}
{{ s.decision.visible }}
{{ s.decision.decideLabel }}
{{ s.decision.decide }}
Academic foundation

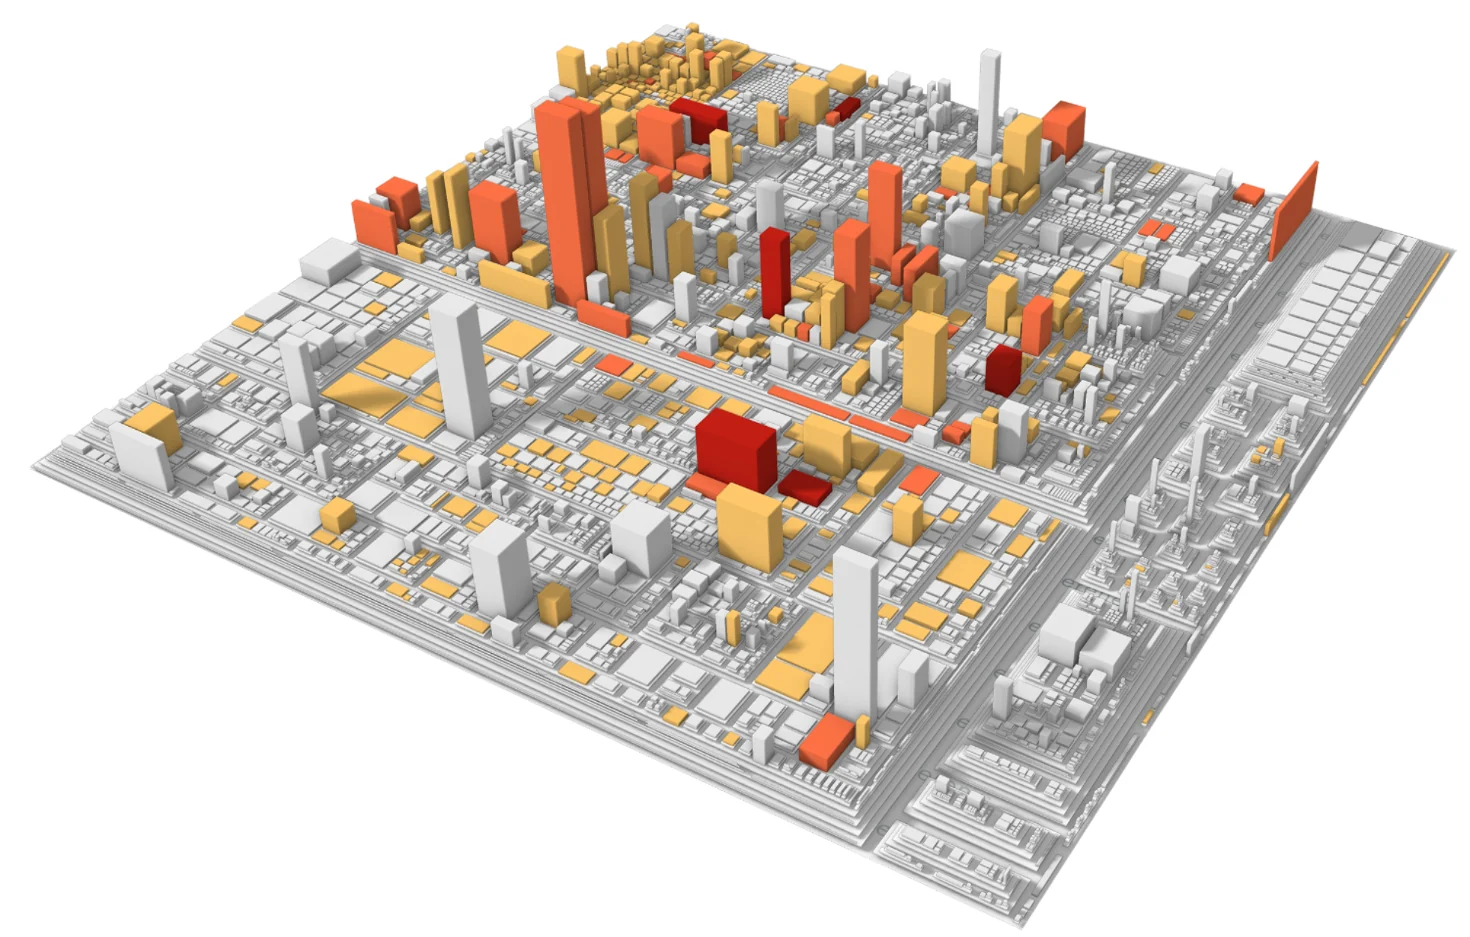
Software maps, the method at the core of Seerene, originate in the research group of Prof. Dr. Jürgen Döllner at the Hasso Plattner Institute, Potsdam.
15+ years
of research on software analysis and visualization
Potsdam
where the research began and where Seerene is based
2024
enterprise-wide connection of software production reliably available
Concept diagram · a portfolio question, as the Digital Boardroom frames it
Where is engineering capacity bound?
Partner integrations
42%
Data platform
31%
Payments platform
27%
Core banking
19%
Mobile channels
14%
Share of capacity absorbed by rework, dependencies and knowledge concentration
Decision this supports. Whether additional capacity for partner integrations would reach the product or be absorbed, and which structural cause to remove first.
Trace · Portfolio → Partner integrations → Interface layer → Rework after late integration. Team and system level only.
Trace · Portfolio → Partner integrations → Interface layer → Rework after late integration. Team and system level only.
Software change throughput vs. enterprise visibility and steering capacity
One management question, five dimensions, the same evidence base.
Digital Boardroom
Cost
Budget and capacity on one basis
Quality
Rework and structural decay
Capacity
Share that reaches the product
Risk
Knowledge concentration, aging systems
Business value
Effort against stated priorities
Trade-offs stay visible. A saving can make later change more expensive; more capacity can create more review effort. The five dimensions are read together, with assumptions and data gaps shown.

{{ s.marker }}
{{ s.heading }}
{{ s.intro }}
{{ c.label }}
{{ c.text }}
{{ s.note }}
{{ s.marker }}
{{ s.heading }}
{{ s.intro }}
{{ it.num }}
{{ it.name }}
{{ it.sub }}
{{ b.text }}
{{ it.title }}
{{ b.text }}
{{ s.marker }}
{{ s.heading }}
{{ s.intro }}
-
{{ it.when }}{{ it.title }}{{ it.who }}
{{ b.text }}
Outcome{{ it.outcome }}
{{ s.note }}
{{ s.marker }}
{{ s.heading }}
{{ s.intro }}
TimingStep · whoWhat happensOutcome
{{ g.start }}
{{ g.label }}
{{ it.when }}
{{ it.ref }}
{{ it.title }}
Who
{{ it.who }}
{{ b.text }}
Outcome
{{ it.outcome }}
{{ s.note }}
{{ s.marker }}
{{ s.heading }}
{{ s.intro }}
-
{{ it.when }}{{ it.title }}{{ it.who }}
{{ b.text }}
{{ s.note }}
{{ s.marker }}
{{ s.heading }}
{{ s.heading }}
{{ f.q }}+
{{ f.a }}
{{ s.marker }}
{{ s.heading }}
{{ s.intro }}
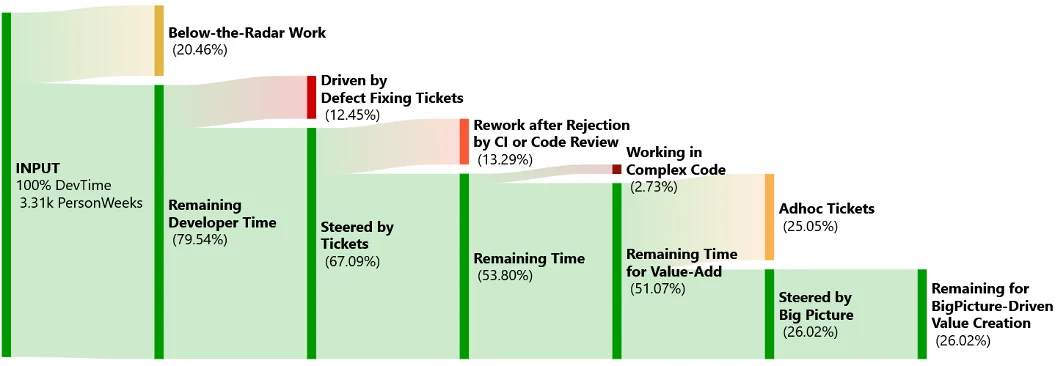
Funded engineering capacity · 100 %
Product work · new functionality
Necessary maintenance
Avoidable rework and friction · redirectable share
Illustrative split, not a benchmark: ranges seen in baseline analyses of 20–40 % of capacity reaching new functionality and 60–80 % maintenance, rework and friction; partly necessary, partly avoidable.
{{ s.link.title }}
{{ s.link.text }}
1 · Impulse
One steering question from the top, e.g. where is capacity bound? Executive KPI Pulse · 15 minutes per review.
2 · Connect
Signals and noise from the existing toolchain are connected and normalized, read-only.
3 · Aggregate and explore
Verified evidence flows back up through teams, business units and functions; every figure stays traceable.
4 · Decide and record
Question, finding, decision, owner and review date are documented together.
The AI paradox · what leadership sees of AI-accelerated code, and what it does not
Software change throughput vs. enterprise visibility and steering capacity
{{ a.text }}
{{ s.marker }}
{{ s.heading }}
{{ s.intro }}
- {{ l.n }}{{ l.title }}
{{ l.body }}
Bottom-up: tool knowledge, software production lines, the Seerene Analytics Layer that fuses their signals, the Software Evidence Layer, the management pyramid on top. The paths show the traces converging into one definition and rising to the apex.
{{ s.marker }}
{{ s.heading }}
{{ s.intro }}
From one-dimensional tool views to three-dimensional software governance.
Every production line runs its own flow and leaves its traces in its tools. Point tools illuminate stages of one line. Seerene connects all three axes: one Evidence Layer, one comparable portfolio view, one evidence path for every management level.
{{ axisCur.label }}
{{ axisCur.title }}
{{ axisCur.body }}
On the model{{ axisCur.whereText }}
Today{{ axisCur.todayText }}
The three axes are the structure of the view. What the view shows are the decision dimensions: cost, capacity, quality, risk and business value, with AI impact as the current lens, on the same definitions at every level.
The structure of the information space: X along one production line, Y across lines 1…N, Z from the lines up through the management levels. Select an axis to mark it on the model.
Useful signals. Partial connections. An incomplete portfolio view.
Today’s tools already connect some stages, and some organizations consolidate them across teams. What often remains fragmented is a consistently defined, traceable view across production lines and management levels. Seerene adds that shared evidence layer.
Switch the state to see the same signals as they are connected today and with Seerene.
{{ gapCaption }}
Cyan the development flow, left to right · pink rework, always back against the flow: the later a defect is found, the longer the loop · every step leaves metadata in repositories, tickets, pipelines and test systems.
Every production line runs the same flow. Seerene reads what it leaves behind.
A software production line is a software system with its engineering teams: from requirements through code, build and test to running software. Local tools see the steps, not the friction between them. The pyramid is built bottom-up from what every line already records.
Work itemsJira · ALM
CommitsGit
Builds and testsCI/CD · test management
Shared definitions + system context
One definition per selected indicator; the system, team and partner behind each figure stay attached.
Production line 1Rework share of capacity · same definitionContext: Customer portal · its teams
Production line 2Rework share of capacity · same definitionContext: Payments platform · its teams and partner
Nothing is replaced or re-entered. Engineering validates the interpretation; leadership sets priorities.
Further reading in CIO
Herausforderung für CIOs: Die Ära der Software Factory
Oliver Viel · 9 November 2020 · German · article by Seerene’s Chief Communication Officer
Read the article →
{{ s.marker }}
{{ s.heading }}
{{ s.intro }}
{{ s.marker }}
{{ s.heading }}
{{ s.intro }}
{{ c.title }}
{{ c.body }}
{{ s.marker }}
{{ s.heading }}
{{ s.intro }}
X-Axis · Development flow · Y-Axis · Production lines · Z-Axis · Management levels. The selected management level is lit in the pyramid; the paths show how the evidence beneath it is built.
{{ lvl.role }}
{{ lvl.q }}
{{ lvl.views }}
{{ lvl.capHiw }}
{{ s.note }}
{{ s.marker }}
{{ s.heading }}
{{ s.intro }}
- {{ st.n }}{{ st.text }} →
{{ p.text }}
{{ s.heading }}
{{ d.title }}
{{ d.body }}
{{ s.marker }}
{{ s.heading }}
{{ s.marker }}
{{ s.heading }}
{{ s.intro }}
Download · step 3 of 3 · released
{{ s.gatePickTitle }}
Thank you. All downloads on this page are now available directly.
{{ s.note }}
{{ s.marker }}
{{ s.heading }}
{{ pp.text }}
{{ s.note }}
Indicative capacity model
Scenario, not a baseline
- Annual engineering investment
- {{ calcInvest }}
- Capacity absorbed by friction
- {{ calcFrictionEur }}
- Recovery potential per year
- {{ calcRecEur }}
- Equivalent capacity for product work
- {{ calcFte }}
Euro and FTE figures derive from the same inputs: recovery potential ÷ cost per developer = FTE equivalent. Shown as redirected capacity for product work, not as a cash saving. Friction and recovery shares are scenario assumptions; the independent baseline replaces them with your organization’s measured profile.
{{ s.marker }}
{{ s.heading }}
{{ s.intro }}
{{ s.heading }}
{{ s.intro }}
- {{ kv.k }}
- {{ kv.v }}
{{ q.role }}
{{ q.name }}
“{{ q.text }}”
{{ s.heading }}
{{ nm.name }}
{{ s.heading }}
{{ s.intro }}
Earlier gatherings
From the stage
{{ recCount }} recorded talks and panels, open to everyone.
Masterclasses and executive exchanges since 2021, published on Seerene’s YouTube channel with the speakers’ consent. Pick a year, open a talk, or go to the gathering it belongs to.
Voices of the Network
{{ wallTotal }} executives and researchers have taken the stage since 2021.
{{ p.name }}
{{ p.org }}
Names, titles and organizations as published on seerene.com at the time of each gathering. Hover a portrait for the gathering(s).
{{ s.note }} All thirteen gatherings have taken place; the next retreat is announced to members first.
News & Insights
Perspectives on governing software production.
Research, executive conversations and method notes on Software Production Governance, AI in software production and the leadership of large engineering organizations. Every piece carries an author and a date; every figure carries its source and period.
{{ a.dateLabel }}
{{ a.kind }}
DEUTSCH
{{ a.title }}
{{ a.blurb }}
{{ a.cluster }} · {{ a.authorLabel }}
{{ articleCount }} articles since 2025 from seerene.com/news, URLs preserved. Entries whose full text is not yet imported show their opening and link to the live article.
From reading to deciding.
If an article raised a question about your own software production, a 30-minute Executive Briefing is the fastest way to find out what the evidence would show.
Insights · {{ article.cluster }} · {{ article.kind }}
{{ article.title }}
{{ article.dek }}
By {{ article.authorLabel }}Published {{ article.dateLabel }}{{ article.revised }} Deutsch
Software Excellence Network · {{ gathering.kind }} · {{ gathering.dateLabel }}
{{ gathering.speakerLine }}
“{{ gathering.session.title }}”
{{ gathering.title }} · {{ gathering.venue }} · Article published {{ gathering.publishedLabel }}
Event page →
{{ b.text }}
{{ r.t }} {{ r.t }} {{ r.t }}
Where engineering capacity goes · aggregate observation · share of total capacity
Defect and rework 22 %Low-quality code 16 %Unaligned work 11 %Knowledge concentration 11 %Product work 40 %
“{{ b.text }}”
{{ b.text }}
{{ article.partialNote }} Read the complete article on seerene.com →
From the gathering · {{ gathering.title }}
{{ gathering.pending }}
In the room · speakers and panelists
{{ gathering.dateLabel }} · {{ gathering.venue }}{{ f }}
{{ p.name }}
{{ p.org }}
Impressions
Documentation and photographs from the Network’s event page, shown with the consent of the people pictured. Full event page →
Related gathering · Software Excellence Network
Related reading
Archive
This entry is not in the archive.
Back to Insights →Software Excellence Network · {{ event.kind }} · {{ event.month }} · {{ event.lang }}
{{ event.title }}
{{ event.lead }}
{{ event.dateLabel }}{{ event.venue }}{{ f }}
Convened by
Software Excellence Network · Hasso Plattner Institute · German Deep Tech Group · Seerene
Ask about membership→
Event page on seerene.com →
Convened by {{ event.partners }}Photographs from seerene.com, shown with the consent of the people pictured.
Presentations
Talks and discussions
{{ event.sessionsNote }}
On stage
Speakers and panelists
{{ p.name }}
{{ p.org }}
Impressions
From the event
Documentary photographs from the gathering, loaded from seerene.com. Shown only with the consent of the people pictured. Full gallery on seerene.com →
Talks and discussions
Titles in the language they were given. Summaries are published only where the speaker agreed.
{{ t.title }}
{{ t.speaker }}
Related · Insights
Where this sits in the series
Thirteen gatherings since 2021, at the Hasso Plattner Institute in Potsdam, in Berlin and at Schloss Fürstlich Drehna. The next retreat is announced to members first.
{{ event.note }}
Executive Briefing
{{ briefH1 }}
{{ briefLead }}
- Duration
- 30 minutes, video call or in person in Potsdam or Berlin.
- Who you meet
- We aim to arrange the briefing with Dr. Johannes Bohnet, CEO, personally. Alternatively, by prior agreement with you, an experienced member of Seerene’s team leads the conversation. For technical validation, Seerene’s engineering lead.
- What you get
- A written summary of your question, the evidence that would settle it and the proposed next step, which you can forward internally.
- Next steps
- If a baseline fits: technical validation call, scoping, specific proposal, independent baseline typically about 30 days from data readiness. If not, we say so.
Prefer to read first? The Executive Brief is a one-page summary written for internal forwarding. Direct contact: hello@seerene.com · +49 (0) 331 706 234 0
Schedule a 30-minute briefing
Pick a time in the calendar. The invitation names who leads the conversation.
The calendar could not be loaded here. Open the calendar in a new tab → or send a request instead.
The calendar is provided by HubSpot. Loading it transfers technical data such as your IP address to HubSpot, as described in the privacy policy.
Prefer us to coordinate? Direct contact: hello@seerene.com
Briefing requested · not yet confirmed
Thank you. We reply within one business day with proposed times.
Within one business day Seerene proposes two or three times and coordinates them with you. The briefing counts as confirmed only once you have accepted a date; you then receive a calendar invitation naming who will lead the conversation.
We aim to arrange the briefing with Dr. Johannes Bohnet personally; alternatively, by prior agreement with you, an experienced member of our team leads it. Nothing to prepare on your side. If you like, forward the Executive Brief to the colleagues who should join.
What a briefing is, and is not
Is this a sales call?+
It is a conversation about your decision. If a baseline is not the right instrument, we tell you. If it is, we tell you what it would cover and cost in effort before anyone talks about a contract.
Can I bring colleagues?+
Yes. The most useful briefings include the executive who owns the decision and the engineering lead who knows the systems.
Do I have to share data beforehand?+
No. The briefing works from your question. Data is only connected in a baseline, after technical validation and scoping.
How do I forward this internally?+
Send the Executive Brief, a one-page summary written for the executive who has to decide, or this page’s stable link, seerene.com/briefing.
Software Excellence Network · Membership
Ask about membership.
The Software Excellence Network is an invitation-only peer forum for CEOs, CIOs, CTOs and senior engineering leaders who run software at scale. Membership begins with an introductory conversation: you describe your role and organization, and the Network tells you plainly whether the forum fits and what the next gatherings are.
- Who it is for
- Senior decision-makers accountable for software at scale: CEOs, CIOs and CTOs, CFOs and board members, VPs and heads of engineering of large organizations.
- What members get
- Executive exchanges in Berlin, retreats at Schloss Fürstlich Drehna and masterclasses at the Hasso Plattner Institute. Peer exchange off the record, practitioners’ masterclasses and early research from academia.
- How it works
- Membership is by invitation. After your enquiry, the Network proposes an introductory conversation and names the gatherings that fit your role and sector.
- Who you talk to
- Oliver Viel, Chief Communication Officer at Seerene, answers membership enquiries personally.
About the forum: the Software Excellence Network · past and upcoming gatherings since 2021. Direct contact: hello@seerene.com
Membership enquiry received
Thank you. Your enquiry has reached the Network.
Oliver Viel gets back to you personally with a proposal for an introductory conversation and the gatherings that fit your role. Membership is confirmed after that conversation.
Executive Brief
One page for the executive who has to decide.
This brief is written to be forwarded: to a CEO, a CIO, a board member or a strategy team. It states the decision need Seerene serves, what the evidence would show, what a baseline asks of the organization and the next step. No registration, no sales follow-up unless you ask for one.
Stable linkseerene.com/executive-brief
Seerene · Executive Brief · October 2026
Software production, governed on evidence
- Decision need
- Leadership decides about software investment, capacity, modernization and AI adoption across a portfolio that no single report describes. Status reports and tool dashboards give local signal, not a comparable management view.
- What Seerene provides
- The Digital Boardroom for Enterprise Software Production: one independent evidence base across cost, quality, capacity, risk and business value, built read-only from the toolchain teams already use, comparable across product lines, teams and partners, and traceable from every management figure to the system, the component and its change history — evidence at code level, without source code leaving your environment.
- What becomes decidable
- Where additional investment reaches the product and where it is absorbed; which systems carry structural risk for the business; what AI adoption has changed in production; whether allocation still matches strategy.
- Evidence and trust
- Engineering leads validate every interpretation before leadership decides. Team and system level only; no individual scoring or ranking. Research origin at the Hasso Plattner Institute; proof is the trace from figure to source.
- What it asks of the organization
- One executive sponsor with a decision to take; one engineering lead for validation; one technical contact for typically about 8 net working hours in total of read-only connection. No new tools, no workflow changes. Security review, procurement and works council alignment planned in parallel.
- Your part
- The executive who owns the question reads the answer in every executive review: 15 minutes with the direct reports, aligned with your management cadence, one verified view, three decisions — where are we off track, who acts next, what changes before the next review. The first four to six rounds are guided. The technical validation can be delegated; the decision cannot.
- Perimeter
- Several production lines that differ in technology and method, up to the whole software production, agreed in scoping. A single team cannot show the portfolio effect.
- Day 30
- An evidence review, not a contractual exit: findings validated by engineering, three to five proposed actions with owners, and a decision to continue, expand or stop.
- Timeline
- Executive Briefing (30 minutes) → technical validation → scoping and offer → independent baseline typically about 30 days from data readiness → review of effect.
- Next step
- Request an Executive Briefing at seerene.com/briefing, or forward this page to the executive who owns the decision.
Generative AI Seerene GmbH · Potsdam · hello@seerene.com · +49 (0) 331 706 234 0
For strategy teams and executive offices
If you are preparing a decision for your executive team, the brief above is the summary. The questions below are the ones that usually come back; the answers are short on purpose.
What is the smallest commitment?+
A 30-minute Executive Briefing. It ends with a written summary and a plain statement of whether a baseline would answer the decision in question.
What does a baseline cost in time?+
Typically about 30 days from data readiness within the agreed scope. On the organization’s side: one validation call, typically about 8 net working hours for a technical point person, and a review session for the engineering leads whose systems appear in the findings.
Is this a transformation program?+
No. Nothing changes for teams. The Digital Boardroom is a management view above the existing toolchain, used by leadership and engineering in a short executive review aligned with your management cadence.
What do we tell the works council?+
That the model works at team and system level, contains no individual metrics, and that the documentation used in previous works council reviews is available for theirs.
Legal
Imprint / Impressum
English, followed by the German version (Deutsch). Website provider: Generative AI Seerene GmbH, Potsdam. The group companies in New York and Hong Kong are listed for completeness; they do not operate this website.
English
- Provider · § 5 DDG
- Generative AI Seerene GmbH
August-Bebel-Straße 26–53, 14482 Potsdam, Germany
Managing Director: Dr. Johannes Bohnet
Commercial register: Amtsgericht Potsdam, HRB 22123 P · VAT ID: DE 266655664
hello@seerene.com · +49 (0) 331 706 234 0 - Group company · USA
- Seerene Inc.
747 Third Avenue, 4th Floor, New York, NY 10017, United States
Managing Directors: Marc Hildebrandt, Sophia Friederike Hoehn - Group company · Hong Kong
- Seerene Asia Limited
Unit A, 25/F, United Center, 95 Queensway, Admiralty, Hong Kong
Managing Director: Mathias Hoehme - Editorial responsibility
- Pursuant to § 18 (2) MStV: Dr. Johannes Bohnet, address as above.
- Liability for content and links
- The contents of these pages were prepared with the greatest possible care; we cannot guarantee their accuracy, completeness or currency. As a service provider we are responsible for our own content under § 7 (1) of the German Digital Services Act (DDG) and the general laws. Under §§ 8 to 10 DDG we are not obliged to monitor transmitted or stored third-party information or to investigate circumstances indicating illegal activity. This website links to external websites of third parties over whose content we have no influence; the respective provider or operator is responsible for the content of linked pages.
- Dispute resolution
- We are neither obliged nor willing to participate in dispute resolution proceedings before a consumer arbitration board (§ 36 VSBG). The European Commission’s online dispute resolution platform was discontinued on 20 July 2025 and is therefore no longer referenced.
- Privacy policy
- The current privacy policy is published at seerene.com/privacy and is migrated unchanged.
About these views
Product screenshots show the Seerene Digital Boardroom using demonstration datasets. Concept diagrams explain the approach and are not application screens. Customer statements and project references are identified separately.
Deutsch
- Anbieter · § 5 DDG
- Generative AI Seerene GmbH
August-Bebel-Straße 26–53, 14482 Potsdam, Deutschland
Geschäftsführer: Dr. Johannes Bohnet
Handelsregister: Amtsgericht Potsdam, HRB 22123 P · USt-IdNr.: DE 266655664
hello@seerene.com · +49 (0) 331 706 234 0 - Konzerngesellschaft · USA
- Seerene Inc.
747 Third Avenue, 4th Floor, New York, NY 10017, USA
Geschäftsführer: Marc Hildebrandt, Sophia Friederike Hoehn - Konzerngesellschaft · Hongkong
- Seerene Asia Limited
Unit A, 25/F, United Center, 95 Queensway, Admiralty, Hongkong
Geschäftsführer: Mathias Hoehme - Verantwortlich für den Inhalt
- Nach § 18 Abs. 2 MStV: Dr. Johannes Bohnet, Anschrift wie oben.
- Haftung für Inhalte und Links
- Die Inhalte dieser Seiten wurden mit größtmöglicher Sorgfalt erstellt; für Richtigkeit, Vollständigkeit und Aktualität können wir keine Gewähr übernehmen. Als Diensteanbieter sind wir gemäß § 7 Abs. 1 DDG für eigene Inhalte auf diesen Seiten nach den allgemeinen Gesetzen verantwortlich. Nach §§ 8 bis 10 DDG sind wir nicht verpflichtet, übermittelte oder gespeicherte fremde Informationen zu überwachen oder nach Umständen zu forschen, die auf eine rechtswidrige Tätigkeit hinweisen. Unser Angebot enthält Links zu externen Websites Dritter, auf deren Inhalte wir keinen Einfluss haben; für die Inhalte der verlinkten Seiten ist stets der jeweilige Anbieter oder Betreiber verantwortlich.
- Streitbeilegung
- Wir sind nicht bereit oder verpflichtet, an Streitbeilegungsverfahren vor einer Verbraucherschlichtungsstelle teilzunehmen (§ 36 VSBG). Die Plattform der Europäischen Kommission zur Online-Streitbeilegung wurde zum 20. Juli 2025 eingestellt und wird daher nicht mehr genannt.
- Datenschutz
- Die aktuelle Datenschutzerklärung ist unter seerene.com/privacy veröffentlicht und wird unverändert übernommen.
Company, register and representation details as published in the current imprint on seerene.com.
Privacy
Privacy Policy
This privacy policy informs you about the nature, scope and purpose of the collection and use of personal data on this website.
Also available in Deutsch.
English
Last updated: April 2026
1. Controller
Generative AI Seerene GmbH, August-Bebel-Straße 26-53, 14482 Potsdam, Germany.
Email: privacypolicy@seerene.com · Phone: +49 (0) 331 706 234 0
2. Scope
This policy explains how we process personal data when you visit www.seerene.com, submit a form, or interact with content we provide. Processing is carried out in accordance with the EU General Data Protection Regulation (GDPR) and the German Federal Data Protection Act (BDSG).
3. Data collected automatically (server logs)
When you access our website, your browser automatically transmits technical information required to deliver the page: IP address, date/time, browser type and version, operating system, referrer URL, and requested resource. This data is processed on the basis of our legitimate interest (Art. 6(1)(f) GDPR) in a stable, secure service, and deleted or anonymised after no more than 30 days.
4. Cookies & similar technologies
We use only strictly necessary cookies by default. Optional cookies (analytics, marketing) are activated only after you grant explicit consent via our cookie banner, in line with § 25 TTDSG / TDDDG and Art. 6(1)(a) GDPR. You can change or withdraw your consent at any time using the button below.
5. Contact & briefing forms (HubSpot)
Our contact forms are embedded via HubSpot (HubSpot Inc., 2 Canal Park, Cambridge, MA 02141, USA). When you submit a form, the data you enter (e.g. name, business email, company, message) is transmitted to HubSpot servers and stored in our CRM. We use this data to respond to your request and to manage the business relationship. Legal basis: Art. 6(1)(b) GDPR (pre-contractual measures) and Art. 6(1)(f) GDPR (legitimate interest in efficient B2B communication).
Transfers to HubSpot in the USA are safeguarded by Standard Contractual Clauses (SCC) and the EU-US Data Privacy Framework. HubSpot’s privacy policy: legal.hubspot.com/privacy-policy.
6. Analytics (Google Analytics 4)
Subject to your consent, we use Google Analytics 4 (Google Ireland Ltd., Gordon House, Barrow Street, Dublin 4, Ireland) to understand how visitors use the site. IP addresses are truncated before storage. Legal basis: Art. 6(1)(a) GDPR. You can withdraw consent at any time via the cookie settings.
These services are loaded via Google Tag Manager, a tag-management tool operated by Google Ireland Ltd. Tag Manager itself sets no analytics or advertising cookies; it only triggers the services listed here after you have given consent. Where data is transferred to Google servers in the USA, this is safeguarded by Standard Contractual Clauses (SCC) and the EU-US Data Privacy Framework.
7. Embedded services
We may embed content from YouTube, LinkedIn, and X/Twitter. These third parties may set their own cookies or process your IP address when the embed loads. We only activate such embeds after you accept the corresponding cookie category.
8. Recipients
Data is processed by Seerene staff and by service providers bound by data-processing agreements (Art. 28 GDPR), including our hosting provider, CRM (HubSpot), and, where consented, analytics providers. We do not sell personal data to third parties.
9. Your rights
Under the GDPR you have the right to access (Art. 15), rectification (Art. 16), erasure (Art. 17), restriction (Art. 18), data portability (Art. 20), objection (Art. 21), and withdrawal of consent (Art. 7(3)) at any time. To exercise these rights, contact privacypolicy@seerene.com. You also have the right to lodge a complaint with a supervisory authority — for Seerene, the competent authority is the State Commissioner for Data Protection and Freedom of Information Brandenburg.
10. Retention
We keep personal data only as long as necessary for the purpose for which it was collected, or as required by statutory retention obligations (e.g. § 257 HGB, § 147 AO). Beyond that, data is deleted or anonymised.
11. Changes to this policy
We may update this policy to reflect changes in our processing activities or the legal environment. The current version is always available at this URL.
Deutsch
Stand: April 2026
1. Verantwortlicher
Generative AI Seerene GmbH, August-Bebel-Straße 26-53, 14482 Potsdam, Deutschland.
E-Mail: privacypolicy@seerene.com · Telefon: +49 (0) 331 706 234 0
2. Geltungsbereich
Diese Datenschutzerklärung informiert über die Verarbeitung personenbezogener Daten beim Besuch von www.seerene.com sowie beim Ausfüllen von Formularen. Die Verarbeitung erfolgt gemäß der EU-Datenschutz-Grundverordnung (DSGVO) und dem Bundesdatenschutzgesetz (BDSG).
3. Automatisch erhobene Daten (Server-Logs)
Beim Aufruf der Website übermittelt Ihr Browser technisch notwendige Daten: IP-Adresse, Datum und Uhrzeit, Browsertyp und -version, Betriebssystem, Referrer-URL und angefragte Ressource. Rechtsgrundlage ist Art. 6 Abs. 1 lit. f DSGVO (berechtigtes Interesse an einem stabilen, sicheren Betrieb). Diese Daten werden spätestens nach 30 Tagen gelöscht oder anonymisiert.
4. Cookies & ähnliche Technologien
Standardmäßig setzen wir nur technisch notwendige Cookies. Optionale Cookies (Analyse, Marketing) werden erst nach Ihrer ausdrücklichen Einwilligung über unser Cookie-Banner aktiviert – gemäß § 25 TDDDG (ehem. TTDSG) und Art. 6 Abs. 1 lit. a DSGVO. Sie können Ihre Einwilligung jederzeit über die Schaltfläche unten ändern oder widerrufen.
5. Kontakt- und Briefing-Formulare (HubSpot)
Unsere Formulare sind über HubSpot eingebunden (HubSpot Inc., 2 Canal Park, Cambridge, MA 02141, USA). Bei Absendung werden Ihre Eingaben (z.B. Name, Geschäftsadresse, Unternehmen, Nachricht) an HubSpot-Server übermittelt und in unserem CRM gespeichert. Zweck ist die Bearbeitung Ihrer Anfrage und die Pflege der Geschäftsbeziehung. Rechtsgrundlage: Art. 6 Abs. 1 lit. b DSGVO (vorvertragliche Maßnahmen) und Art. 6 Abs. 1 lit. f DSGVO (berechtigtes Interesse an effizienter B2B-Kommunikation).
Übermittlungen an HubSpot in die USA sind durch Standardvertragsklauseln (SCC) und das EU-US Data Privacy Framework abgesichert. Datenschutzerklärung HubSpot: legal.hubspot.com/privacy-policy.
6. Analyse (Google Analytics 4)
Nach Ihrer Einwilligung nutzen wir Google Analytics 4 (Google Ireland Ltd., Gordon House, Barrow Street, Dublin 4, Irland) zur anonymisierten Reichweitenmessung. IP-Adressen werden vor der Speicherung gekürzt. Rechtsgrundlage: Art. 6 Abs. 1 lit. a DSGVO. Ein Widerruf ist jederzeit über die Cookie-Einstellungen möglich.
Diese Dienste werden über den Google Tag Manager eingebunden, ein Tag-Verwaltungswerkzeug der Google Ireland Ltd. Der Tag Manager selbst setzt keine Analyse- oder Werbe-Cookies; er löst die hier genannten Dienste erst nach Ihrer Einwilligung aus. Soweit dabei Daten an Google-Server in den USA übertragen werden, ist dies durch Standardvertragsklauseln (SCC) und das EU-US Data Privacy Framework abgesichert.
7. Eingebettete Dienste
Wir betten gelegentlich Inhalte von YouTube, LinkedIn und X/Twitter ein. Diese Dienste können beim Laden eigene Cookies setzen oder Ihre IP-Adresse verarbeiten. Solche Einbettungen werden nur nach Ihrer entsprechenden Cookie-Einwilligung aktiviert.
8. Empfänger
Daten werden durch Seerene-Mitarbeitende und durch Auftragsverarbeiter nach Art. 28 DSGVO verarbeitet, u.a. unser Hosting-Provider, unser CRM (HubSpot) und — bei erteilter Einwilligung — Analyse-Anbieter. Ein Verkauf personenbezogener Daten findet nicht statt.
9. Ihre Rechte
Nach der DSGVO haben Sie das Recht auf Auskunft (Art. 15), Berichtigung (Art. 16), Löschung (Art. 17), Einschränkung (Art. 18), Datenübertragbarkeit (Art. 20), Widerspruch (Art. 21) und jederzeitigen Widerruf einer Einwilligung (Art. 7 Abs. 3). Zur Geltendmachung Ihrer Rechte wenden Sie sich an privacypolicy@seerene.com. Außerdem steht Ihnen das Beschwerderecht bei einer Aufsichtsbehörde zu — für Seerene ist dies die Landesbeauftragte für den Datenschutz und für das Recht auf Akteneinsicht Brandenburg.
10. Speicherdauer
Personenbezogene Daten werden nur so lange gespeichert, wie dies für den jeweiligen Zweck erforderlich ist oder gesetzliche Aufbewahrungspflichten bestehen (z.B. § 257 HGB, § 147 AO). Darüber hinaus werden Daten gelöscht oder anonymisiert.
11. Änderungen dieser Erklärung
Wir passen diese Datenschutzerklärung an, wenn sich Verarbeitungen oder die Rechtslage ändern. Die jeweils aktuelle Fassung ist stets unter dieser URL abrufbar.
404